...
| Sv translation | ||||||||||||||||||||||||||||||||||||
|---|---|---|---|---|---|---|---|---|---|---|---|---|---|---|---|---|---|---|---|---|---|---|---|---|---|---|---|---|---|---|---|---|---|---|---|---|
| ||||||||||||||||||||||||||||||||||||
You can use the dashboard to define your individual start page.
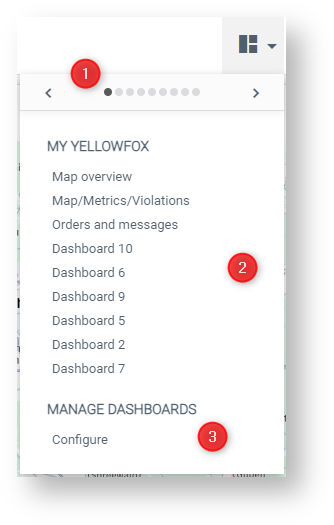
Manage dashboardsWhen logging into the portal for the first time, every user has a dashboard with the overview map. To create, edit or list additional dashboards, click on the icon at the top right (see picture 1). A dialog opens with an overview of the dashboards you have created (similarly picture 2).
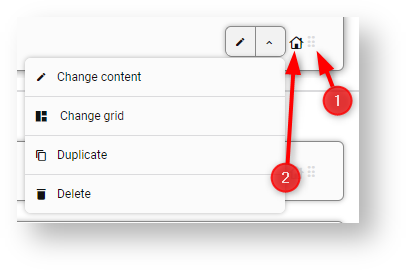
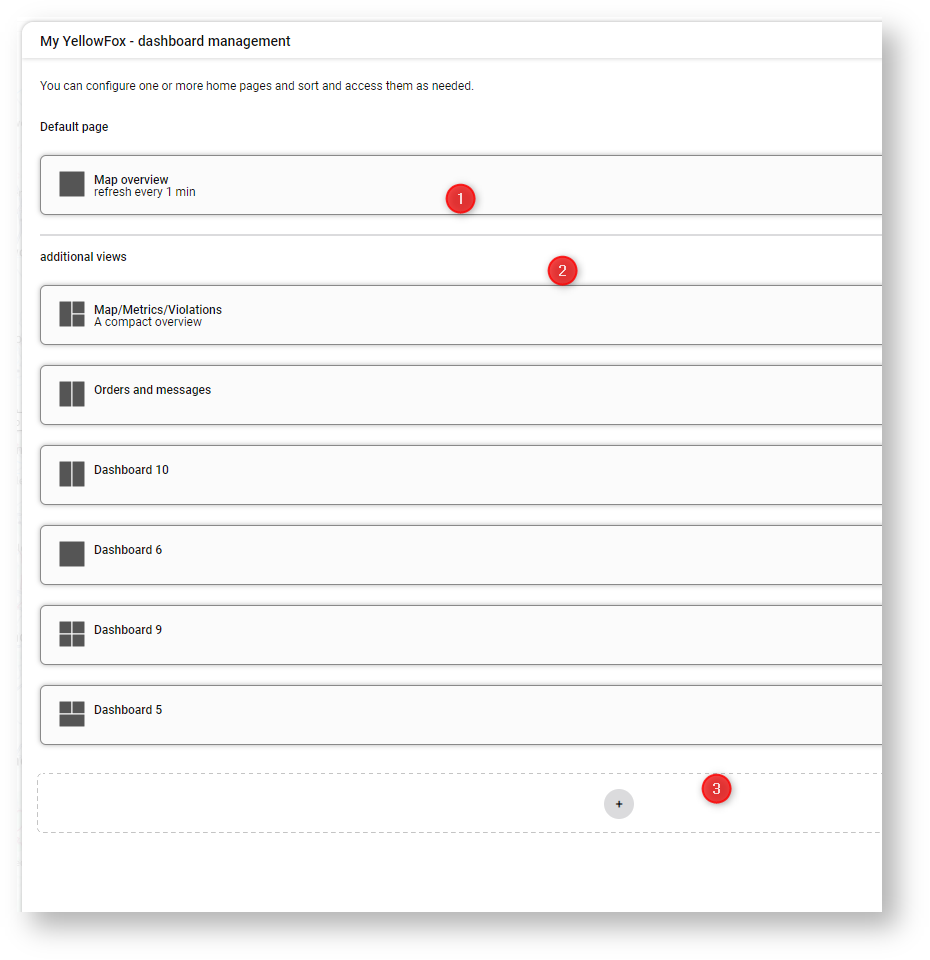
(picture 1) Dashboard overviewUm Dashboards anlegen und bearbeiten zu können, klicken Sie unter Dashboards Verwaltenauf Konfiguration (Abbildung 2 Punkt 3). Es öffnet sich ein Dialog (Abbildung 3).To create and edit dashboards, click on Configure under Manage dashboards (Picture 2, number 3). A dialog opens (Picture 3). Here you get an overview of all your dashboards: The top dashboard is your default view. This is where you start when you log in (Picture 3, number 1). Below this, you will see your other dashboards under Other views. The order is the same like the order used when switching between dashboards. You can therefore change the order by dragging and dropping. (Picture 3, number 2) In the bottom section, you can create a new dashboard by clicking on the plus symbol. Each dashboard element in the overview contains the following functions. You can use the icon under number 1 in the following picture to change the order of the elements using drag-and-drop. You can use the house icon under number 2 to set the dashboard as the start view. The current start dashboard moves to the top position under Other views Hier erhalten Sie zunächst eine Übersicht über all Ihre Dashboards: Das oberste Dashboard ist Ihre Standardansicht. Damit starten Sie, wenn Sie sich einloggen (Abb. 3, Punkt 1). Darunter sehen Sie unter Weitere Ansichten Ihre restlichen Dashboards. Die Reihenfolge ist identisch zu der, die beim Wechseln zwischen den Dashboards genutzt wird. Sie können die Reihenfolge daher per Drag-and.-Drop verändern. (Abb. 3, Punkt 2) In dem untersten Bereich kann mit Klick auf das Plus-Symbol ein neues Dashboard angelegt werden. Jedes Dashboard-Element in der Übersicht enthält folgende Funktionen. Über das Icon unter Punkt 1 können Sie per Drag-and-Drop die Reihenfolge der Elemente verändern. Über das Haus-Symbol unter Punkt 2 können Sie das Dashboard als Startansicht festlegen. Das bis dato aktuelle Startdashboard rutscht dazu unter Weitere Ansichten an die oberste Position.
Other actions:
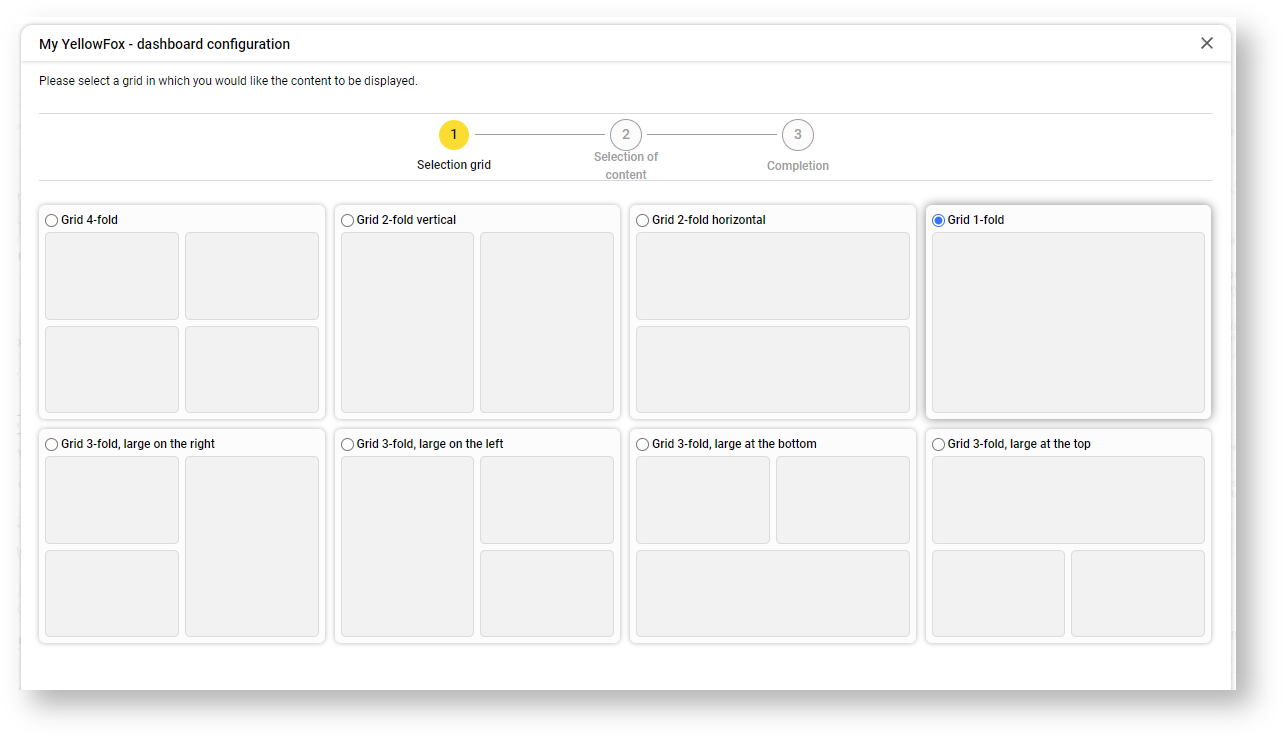
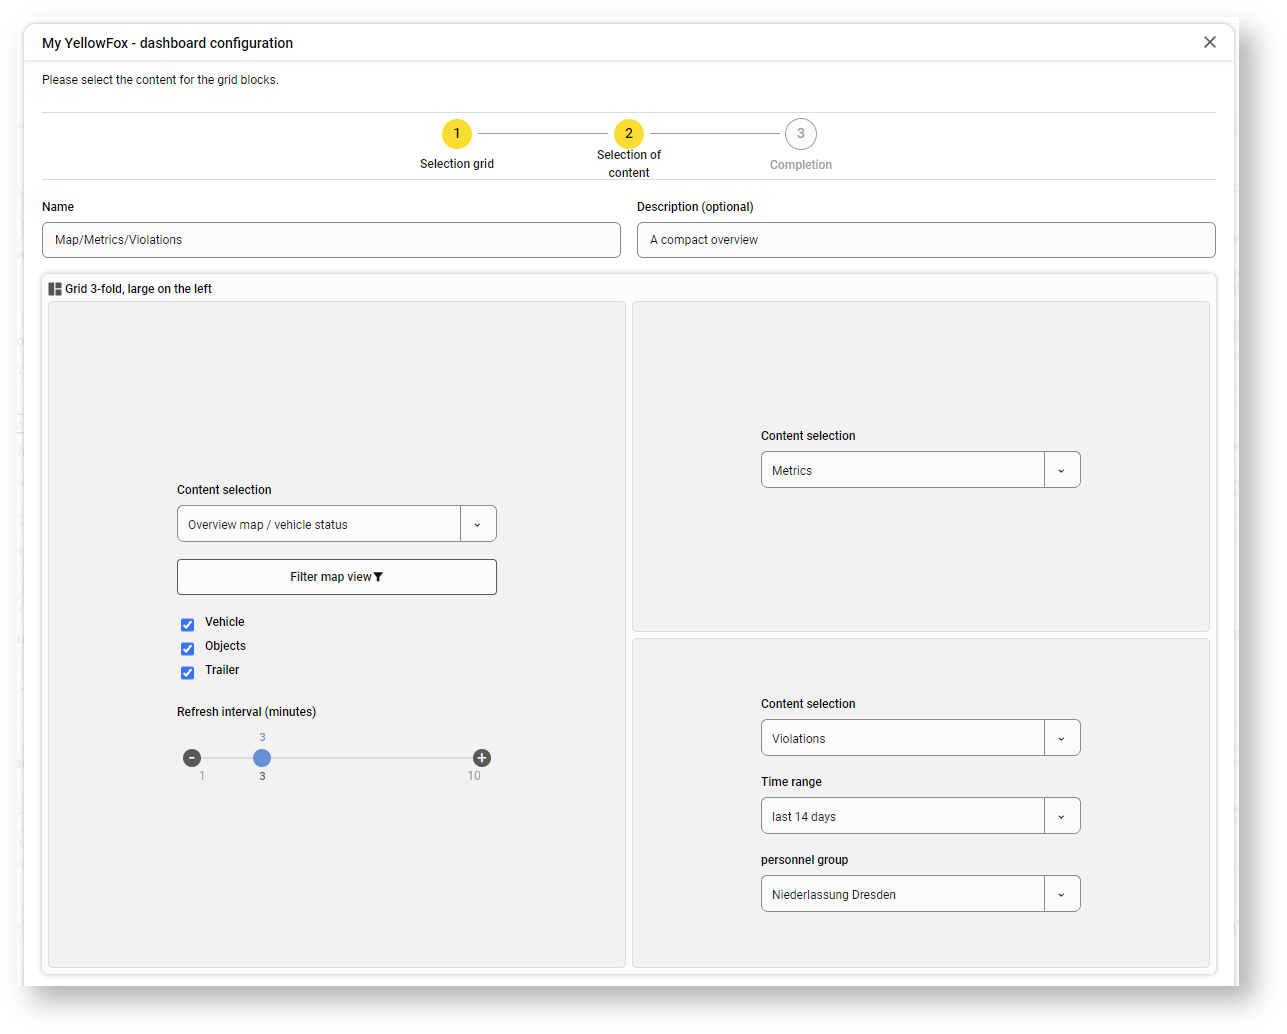
Create or edit dashboardsCreating a dashboard is divided into three steps:
If you want to exit the My Yellowfox - dashboard configuration without saving, click on the X symbol in the top right-hand corner and you will be asked again whether you want to discard the entries in order to return to the dashboard overview. Use dashboardsThe dashboard is your individual start page when you log in. You can also return there by clicking on the YellowFox logo at the top left of the portal. You have several options for switching between different dashboards. Select dashboards directlyClick on the name of the dashboard (Picture 2) to switch directly to it. This allows you to quickly switch to a specific dashboard. Change dashboardsBased on the defined order of the dashboards, you can also change the dashboards one by one. To do this, use the arrows in the list of dashboards (Picture 2) or alternatively the arrows at the edge of the screen. If you look closely at the edge of the browser on the left and right, you will see three dots on a light gray bar. These highlight a button for switching dashboards. If the mouse cursor is moved over these three points, a semi-circular button with an arrow appears. Click on the left-hand side to go to the previous dashboard and on the right-hand side to the next one.
(Picture 2)
(Picture 3)
(Picture 4)
(Picture 5) |