

Kennzahlen
Inhaltsverzeichnis
Kennzahlen geben Ihnen die Möglichkeit, alle wichtigen Informationen direkt beim Login auf einen Blick zu sehen.
Verfügbare Kennzahlen
YellowFox stellt Ihnen eine Vielzahl verschiedener Kennzahlen zur Verfügung. Bitte beachten Sie, dass Kennzahlen von Ihren freigeschalteten Modulen, Ihren Portal- sowie Fahrzeugrechten abhängig sind. Es kann daher sein, dass Ihnen nicht alle aufgeführten Kennzahlen auch angeboten werden.
| Gruppe | Kennzahl | Beschreibung |
|---|---|---|
| Alarme | unbestätigte Alarme | Anzahl der Alarme aus dem Alarmmanager, die noch nicht bestätigt wurden. Für diese Kennzahl benötigen Sie mindestens das Recht "sehen" für den Alarmmanager. |
| Tacho Verstöße | Digitacho offene Belehrungen | Anzahl der Verstöße für die noch kein Belehrungsprotokoll erstellt wurde. Für diese Kennzahl benötigen Sie mindestens das Recht "sehen" für Personal- und Digitachodaten. Ihre Firma muss das Tacho-Archiv aktiviert haben. |
| Digitacho gedruckte Belehrungen | Anzahl der Verstöße, für die bereits ein Belehrungsprotokoll erstellt wurde. Für diese Kennzahl benötigen Sie mindestens das Recht "sehen" für Personal- und Digitachodaten. Ihre Firma muss das Tacho-Archiv aktiviert haben. | |
| Summe Schweregrade (MI) | Diese Kennzahlen summieren die Verstöße Ihrer Fahrer anhand der Schweregrade nach EU VO 2016/403.
| |
| Summe Schweregrade (SI) | ||
| Summe Schweregrade (VSI) | ||
| Summe Schweregrade (MSI) | ||
| Durschnitt Schweregrade (MI) | ||
| Durschnitt Schweregrade (SI) | ||
| Durschnitt Schweregrade (VSI) | ||
| Durschnitt Schweregrade (MSI) | ||
| Digitacho Geschwindigkeitsüberschreitungen | Diese Kennzahlen beschäftigen sich mit Aktivitäten, die über den Digitacho Ihrer Fahrzeuge übermittelt wurden. Für diese Kennzahlen benötigen Sie mindestens das Recht "sehen" für Digitachodaten. Ihre Firma muss das Tacho-Archiv aktiviert haben. | |
| Digitacho Kartenbedienfehler | ||
| Digitacho Störungen | ||
| Digitacho OutOfScope | ||
| Digitacho ITS Ablehnungen | ||
| Ausstehende Digitacho Tachoprüfungen | ||
| Digitacho Sicherheitsverletzungen | ||
| Anzahl Verstöße | Die Gesamtanzahl alle Verstöße Ihrer Fahrer. Für diese Kennzahlen benötigen Sie mindestens das Recht "sehen" für Personal- und Digitachodaten. Ihre Firma muss das Tacho-Archiv aktiviert haben. | |
| Personal | Anzahl Fahrer mit Verstößen | Anzahl der Fahrer die mindestens einen Verstoß haben. Für diese Kennzahl benötigen Sie mindestens das Recht "sehen" für Personal- und Digitachodaten. Ihre Firma muss das Tacho-Archiv aktiviert haben. |
| Anzahl Personal | Anzahl alle Personen auf die Sie die benötigten Rechte haben. Für diese Kennzahl benötigen Sie mindestens das Recht "sehen" für Personaldaten. | |
| Anzahl Personal mit Fahrerkarte | Diese Kennzahlen summieren Ihr Personal anhand der hinterlegten Personalschlüssel. Für diese Kennzahlen benötigen Sie mindestens das Recht "sehen" für Personaldaten. | |
| Anzahl Personal ohne Fahrerkarte | ||
| Geschwindigkeitswarnungen (Fahrer) | Die Anzahl aller Geschwindigkeitswarnungen der ausgewählten Fahrer. Für diese Kennzahlen benötigen Sie mindestens das Recht "sehen" für Personaldaten. | |
| Ø Treibstoffverbrauch (Fahrer) | Der durchschnittliche Treibstoffverbauch aller Fahrer pro km. Für diese Kennzahlen benötigen Sie mindestens das Recht "sehen" für Personaldaten. | |
| Strecke Bremse (Fahrer) | Die Gesamtstrecke der jeweiligen Bremse aller ausgewählten Fahrer. Für diese Kennzahlen benötigen Sie mindestens das Recht "sehen" für Personaldaten. | |
| Strecke Gesamtbremse (Fahrer) | ||
| Strecke Retarder (Fahrer) | ||
| Tempomat (Fahrer) | Die Dauer der Tempomatnutzung aller ausgewählten Fahrer. Für diese Kennzahlen benötigen Sie mindestens das Recht "sehen" für Personaldaten. | |
| Tempomat Nutzung (Fahrer) | Die durchschnittliche Prozentwert der Tempomatnutzung aller ausgewählten Fahrer im Verhältnis zur Fahrzeit. Für diese Kennzahlen benötigen Sie mindestens das Recht "sehen" für Personaldaten. | |
| Treibstoffverbrauch (Fahrer) | Die Summe des Treibstoffverbrauches aller ausgewählten Fahrer. Für diese Kennzahlen benötigen Sie mindestens das Recht "sehen" für Personaldaten. | |
| Bußgelder | Bußgelder Fahrer (gesamt) | Diese Kennzahlen beschäftigen Sich mit den Verstößen Ihrer Fahrer und den daraus entstehenden Bußgeldern. Sie können sich diese als Gesamtsumme anzeigen lassen oder nach bestimmten Arten von Verstößen filtern. Für diese Kennzahlen benötigen Sie mindestens das Recht "sehen" für Personal- und Digitachodaten. Ihre Firma muss das Tacho-Archiv aktiviert haben. |
| Bußgelder Firma (gesamt) | ||
| Bußgelder Fahrer Lenkzeitverstöße | ||
| Bußgelder Firma Lenkzeitverstöße | ||
| Bußgelder Fahrer Arbeitszeitverstöße | ||
| Bußgelder Firma Arbeitszeitverstöße | ||
| Bußgelder Fahrer Ruhezeitverstöße | ||
| Bußgelder Firma Ruhezeitverstöße | ||
| Bußgelder Fahrer sonstige Verstöße | ||
| Bußgelder Firma sonstige Verstöße | ||
| Tacho Download | Fahrzeuge ohne Digitacho Download | Anzahl der Fahrer/Fahrzeuge die seit 10 Tagen keinen Download durchgeführt haben. Für diese Kennzahlen benötigen Sie mindestens das Recht "sehen" Digitachodaten. Für Fahrer benötigen Sie weiterhin das Recht auf Personaldaten. |
| Fahrer ohne Digitacho Download | ||
| Fahrzeuge mit erreichter Digitacho Downloadfrist | Massenspeicherdaten müssen regelmäßig archiviert werden. Diese Kennzahlen warnen Sie, wenn die Frist erreicht wurde. Für diese Kennzahlen benötigen Sie mindestens das Recht "sehen" Digitachodaten. Für Fahrer benötigen Sie weiterhin das Recht auf Personaldaten. | |
| Fahrer mit erreichter Digitacho Downloadfrist | ||
| Fahrzeuge | Fahrzeuge mit fehlender Unternehmenssperre | Anzahl der Fahrzeuge die laut Tachograph noch nie auf ein Unternehmen gesperrt waren oder deren letzte Unternehmenssperre abgelaufen ist. Für diese Kennzahlen benötigen Sie mindestens das Recht "sehen" für Digitachodaten. Ihre Firma muss das Tacho-Archiv aktiviert haben. |
| Anzahl Fahrzeuge | Anzahl der Fahrzeuge in Ihrem Fuhrpark, auf die Sie die benötigten Rechte haben. | |
| Anzahl Fahrzeuge mit Telemetrieeingang an/aus | Anzahl der Fahrzeuge, die einen bestimmten Telemetrieeingang aktiv oder inaktiv haben. Den Telemetrieeingang können Sie selbst wählen, es könnte z.B. die Zündung sein. | |
| Anzahl Fahrzeuge mit gekoppelten Trailer | Anzahl der Fahrzeuge die gerade aktiv bzw. nicht mit einem Trailer mit YellowFox Telematik verbunden sind. Für diese Kennzahl benötigen Sie das Recht "sehen" für Trailer. Weiterhin müssen Sie Rechte auf mindestens einen Trailer haben. | |
| Anzahl Fahrzeuge ohne Trailer | ||
| Anzahl ungekoppelter Trailer | Anzahl der als Trailer registrierten Fahrzeuge die gerade nicht mit einem Fahrzeug mit YellowFox Telematik verbunden sind. Für diese Kennzahl benötigen Sie das Recht "sehen" für Trailer. Weiterhin müssen Sie Rechte auf mindestens einen Trailer haben. | |
| Anzahl Aktiver Nebenantrieb | Anzahl der Fahrzeuge, aus dem für die Kennzahl gewählten Fahrzeuge, mit aktivem Nebenantrieb, auf die Sie die benötigten Rechte haben. | |
| Anzahl Fahrten | Anzahl aller Fahrten, aus dem für die Kennzahl gewählten Fahrzeuge, auf die Sie die benötigten Rechte haben. | |
| Anzahl Privatfahrten | Anzahl aller Privatfahrten, aus dem für die Kennzahl gewählten Fahrzeuge, auf die Sie die benötigten Rechte haben. | |
| CO2 Emission | Summe des CO2-Ausstoßes, der für die Kennzahl gewählten Fahrzeuge, auf die Sie die benötigten Rechte haben. Grundlage dafür ist der in den fahrzeugbezogenen Einstellungen hinterlegte CO2-Wert in Kombination mit dem verrbauchten Treibstoff. | |
| Erreichte Servicedistanz | Anzahl der Fahrzeuge, die den eingestellten Schwellwert erreicht haben, aus dem für die Kennzahl gewählten Fahrzeuge, auf die Sie die benötigten Rechte haben. | |
| Fahrzeuge in Bewegung | Anzahl der Fahrzeuge in Bewegung, aus dem für die Kennzahl gewählten Fahrzeuge, auf die Sie die benötigten Rechte haben. | |
| Fahrzeuge in Stillstand | Anzahl der Fahrzeuge im Stillstand, aus dem für die Kennzahl gewählten Fahrzeuge, auf die Sie die benötigten Rechte haben. | |
| Fahrzeuge mit niedriger Tankfüllmenge 1 | Anzahl der Fahrzeuge, die den eingestellten Schwellwert zur Füllstandsmenge erreicht haben, aus dem für die Kennzahl gewählten Fahrzeuge, auf die Sie die benötigten Rechte haben. | |
| Fahrzeuge mit niedriger Tankfüllmenge 2 | Anzahl der Fahrzeuge, die den eingestellten Schwellwert zur Füllstandsmenge erreicht haben, aus dem für die Kennzahl gewählten Fahrzeuge, auf die Sie die benötigten Rechte haben. | |
| Geschwindigkeitswarnungen | Anzahl der Geschwindigkeitsmeldungen, aus dem für die Kennzahl gewählten Fahrzeuge, auf die Sie die benötigten Rechte haben. | |
| Laufleistung | Gesamtsumme der Laufleistung, aus dem für die Kennzahl gewählten Fahrzeuge, auf die Sie die benötigten Rechte haben. | |
| Motorbetriebsstunden | Gesamtsumme der Motorbestriebsstunden, aus dem für die Kennzahl gewählten Fahrzeuge, auf die Sie die benötigten Rechte haben. | |
| Niedriger Adblue Füllstand | Anzahl der Fahrzeuge, die den eingestellten Schwellwert erreicht haben, aus dem für die Kennzahl gewählten Fahrzeuge, auf die Sie die benötigten Rechte haben. | |
| Niedriger Bremsdruck Kreis 1 | Anzahl der Fahrzeuge, die den eingestellten Schwellwert erreicht haben, aus dem für die Kennzahl gewählten Fahrzeuge, auf die Sie die benötigten Rechte haben. | |
| Niedriger Bremsdruck Kreis 2 | Anzahl der Fahrzeuge, die den eingestellten Schwellwert erreicht haben, aus dem für die Kennzahl gewählten Fahrzeuge, auf die Sie die benötigten Rechte haben. | |
| Ø Treibstoffverbrauch | Durchschnittlicher Treibstoffverbrauch pro Kilometer, aus dem für die Kennzahl gewählten Fahrzeuge, auf die Sie die benötigten Rechte haben. | |
| Strecke Bremse | Gesamtstrecke der Betriebsbremse, aus dem für die Kennzahl gewählten Fahrzeuge, auf die Sie die benötigten Rechte haben. | |
| Strecke Gesamtbremse | Gesamtstrecke der Betriebsbremse und des Retarders (beide gleichzeitig genutzt), aus dem für die Kennzahl gewählten Fahrzeuge, auf die Sie die benötigten Rechte haben. | |
| Strecke Retarder | Gesamtstrecke des Retarders, aus dem für die Kennzahl gewählten Fahrzeuge, auf die Sie die benötigten Rechte haben. | |
| Tempomat Nutzung | Der durchschnittliche Prozentwert der Tempomatnutzung aller ausgewählten Fahrzeuge im Verhältnis zur Fahrzeit, auf die Sie die benötigten Rechte haben. | |
| Tempomat | Gesamtdauer des Tempomats, aus dem für die Kennzahl gewählten Fahrzeuge, auf die Sie die benötigten Rechte haben. | |
| Treibstoffverbrauch | Gesamttreibstoffverbrauch, aus dem für die Kennzahl gewählten Fahrzeuge, auf die Sie die benötigten Rechte haben. |
Kennzahlen aktivieren
Kennzahlen werden auf Ihrer persönlichen Startseite dargestellt. Um Kennzahlen zu dieser hinzuzufügen, gehen Sie bitte über das Hauptmenü zu Benutzereinstellungen → Mein YellowFox. Hier können Sie die Aufteilung Ihrer Startseite ändern. Für die Kennzahlen wählen Sie bitte als Inhalt "Kennzahlen". Um die angezeigten Kennzahlen selbst zu bearbeiten, müssen Sie nun zur Startseite wechseln.
Kennzahlen konfigurieren
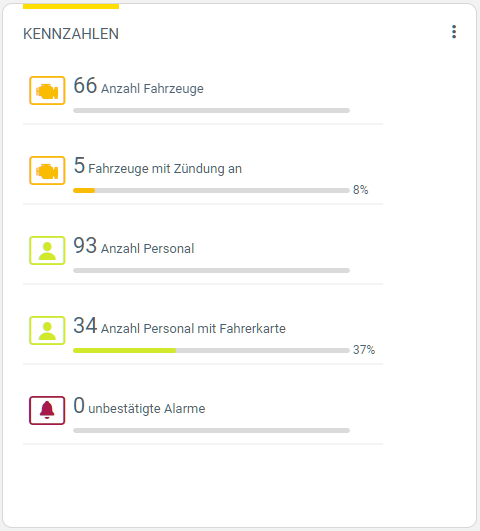 Nachdem Sie die Kennzahlen aktiviert haben, werden auf Ihrer Startseite zunächst eine Reihe von vorkonfigurierten Kennzahlen angezeigt. Um diese zu bearbeiten klicken Sie bitte auf die 3 Punkt oben rechts und wählen "Kennzahlen bearbeiten". Die Kennzahlen werden nun in einen Editiermodus versetzt. Um Ihre Änderungen zu speichern, müssen Sie diesen Modus über "Speichern" beenden.
Kennzahlen verschieben
Ist der Editiermodus aktiviert, können Sie die Kennzahlen per Drag and Drop verschieben.
Kennzahlen entfernen
Um eine Kennzahl zu entfernen, klicken Sie im Editiermodus auf das Papierkorb-Symbol in der oberen rechten Ecke der Kennzahl.
Kennzahlen bearbeiten und Anlegen
Um eine Kennzahl zu bearbeiten, klicken Sie im Editiermodus auf das Zahnrad-Symbol in der oberen rechten Ecke der Kennzahl. Um eine neue Kachel hinzuzufügen, befindet sich am Ende der bisherigen Kennzahlen eine leere Kachel "Kennzahl auswählen". Klicken Sie darauf um eine neue Kennzahl hinzuzufügen oder eine Vorlage zu laden.
Es öffnet sich ein neuer Dialog, in welchem Sie nun die Einstellungen Ihrer Kennzahl setzen können. Als erstes wählen Sie dazu den Typ der Kennzahl aus. Anschließend setzen Sie den Namen der Kennzahl. Dieser wird zur Anzeige auf Ihrer Startseite verwendet. Wenn Sie keinen Namen setzen, wird der Standardname verwendet.
Je nach Typ verändern sich die verfügbaren Einstellungen. Einige Kennzahlen basieren auf Fahrzeugen, andere wiederum auf Trailern, Tachofahrzeugen oder Personen. Bei allen gilt die Regel: wählen Sie keine Personen oder Fahrzeuge explizit aus, so werden alle benutzt für welche Sie die benötigten Rechte besitzen. Alternativ können Sie bestimmte Personen/Fahrzeuge oder auch Gruppen hinterlegen.
Je nach Kennzahl wählen Sie anschließend Dinge wie einen Zeitraum oder Telemetrieeingänge aus. Abschließend setzen Sie noch die Farbe, die die Kennzahl auf Ihrer Startseite annehmen soll. Dabei können Sie optional auch Grenzwerte einstellen, ab welchen die Kachel eine alternative Farbe annehmen soll. So können Sie schnell positive oder negative Veränderungen erfassen.
Während des Editierens wird Ihnen eine Vorschau Ihrer neuen Kennzahl angezeigt. Bitte beachten Sie, dass es sich bei den dargestellten Werten in der Vorschau um Beispieldaten und nicht um reale Werte handelt.
Zusätzlich stellt Ihnen Yellowfox eine Reihe an konfigurierten Vorlagen zur Auswahl. Klicken Sie auf "Vorlage auswählen" um eine neuen Dialog zu öffnen. Wählen Sie hier die gewünschte Vorlage aus. Es wird Ihnen eine Vorschau der enthaltenen Kennzahlen angezeigt. Bitte beachten Sie, dass es sich auch hierbei um Beispieldaten handelt. Klicken Sie auf "Verwenden" um die Kennzahlen zu Ihrer Startseite hinzuzufügen. Sie können diese nun auch noch einmal bearbeiten, um beispielsweise Farben oder Texte zu verändern. Schließen Sie die Bearbeitung schließlich mittels "Speichern" ab, um Ihre Änderungen zu übernehmen.
Kennzahlen Weiterleitung
Eine Kennzahl erlaubt es direkt in ein Modul zu gelangen, um die Informationen, die die Kennzahl repräsentiert dazustellen.
Das ist ganz einfach durch Klicken auf die Kennzahl möglich, wenn der Editiermodus nicht aktiv ist.
Dann erfolgt eine Weiterleitung in das entsprechende Modul und die Daten der Kennzahl werden angezeigt.
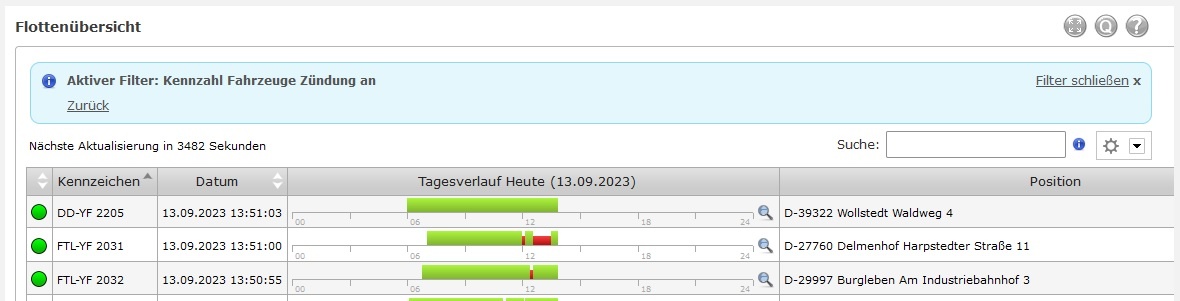
Zum Bespiel: Zeigt die Kennzahl "Fahrzeuge mit Zündung an" den Wert drei an und klickt man auf diese, wird man in die Flottenübersicht weitergeleitet.
Dort werden genau die drei Fahrzeuge angezeigt, die gerade Zündung an haben.
Das Modul, in das weitergeleitet wird, hängt von der Art der Informationen ab.
In dem Modul wird dann eine Info Box angezeigt, die anzeigt, dass die Informationen für eine Kennzahl gefiltert sind.
Es enthält ebenfalls einen Zurück Link, dass direkt zu dem Kennzahlen Dashboard zurück führt.
Weiterhin erlaubt es der Link "Filter schließen" die normale Ansicht des Moduls wieder zu öffnen.